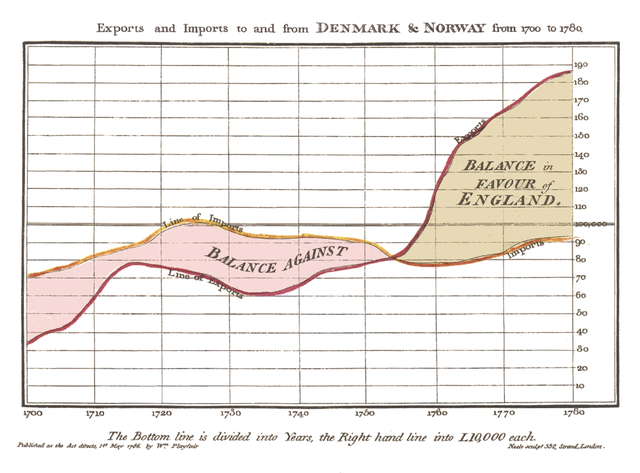
"William Playfair's Time Series of Exports and Imports of Denmark and Norway, 1786." Licensed under Public Domain via Wikimedia Commons. Add'l info about Wm. Playfair
Description
This course will give students a foundation in the principles and practice of data visualization, particularly as applied to scientific and technical data. We will have weekly lectures, covering a wide variety of topics including human perception, color theory, principles of visual design, etc. We will also have weekly hands-on laboratory sessions in which students will have the opportunity to put the lecture material into practice.
Lab sessions will largely use the open-source R and ggplot tools, though others will be featured as well.
We taught a much smaller version of this course back in 2014; as before, we guarantee that students taking this class will see a positive impact on evolutionary fitness.
Logistics
- Location
- Gaines Hall, Room 5
- Time
- Tuesdays (lectures) & Thursdays (labs), 16:00 – 17:30
Schedule
Note: Topics and speakers may change through the term as we adjust our course plan.
| Week | Date | Topic | Materials | Readings |
|---|---|---|---|---|
| 1 | 9/27/16 | Introduction: data/ink, why graphs | Slides | |
| 1 | 9/29/16 | LAB: R, basics of ggplot | 01-intro_lab.html, 01-intro_lab.Rmd, 2016 ggplot Data Jamboree materials | |
| 2 | 10/4/16 | Visual perception | Jackie's Slides | Steven's Slides | Cleveland & McGill 1984, Heer & Bostock 2010, Cleveland et al. 1982, Elliott 2016, Kosara 2016 |
| 2 | 10/6/16 | LAB: How to tweak things in ggplot | 02-ggplot-tweaks.html (Rmd), addm-since-2006.csv (citation) | |
| 3 | 10/11/16 | Color | Slides | |
| 3 | 10/13/16 | LAB: Color palletes, save output (PDF/PNG/etc) | 03-ggplot_colors.Rmd, 03-ggplot_colors.html, Steve's ggsave slides | |
| 4 | 10/18/16 | Graphs | Jackie's Slides | Steven's Slides | |
| 4 | 10/20/16 | LAB: visualizing distributions (box plots, etc.) & error bars | Weissgerber 2015, Krzywinski 2013, Krzywinski 2014 | |
| 5 | 10/25/16 | Fonts & Tables | Fonts | Tables | |
| 5 | 10/27/16 | LAB: tidyr, pixidust | 05-lab.Rmd, 05-lab.html; dplyr Babynames Drill | |
| 6 | 11/1/16 | Maps | Slides | Gamio 2016, Cartonerd 2016, vis4 2016, Hennig 2016 |
| 6 | 11/3/16 | Lab: TBD | ||
| 7 | 11/8/16 | Networks & Trees | Slides | |
| 7 | 11/10/16 | LAB: Robin, Sci2 | druker.cleaned.scopus | |
| 8 | 11/15/16 | Multiple dimensions & Dimensionality Reduction | Slides | Sedlmair et al. 2012, Sedlmair et al. 2013, Brehmer et al. 2014 |
| 8 | 11/17/16 | LAB: high dimensional data viz (heatmaps, parallel coords, etc.) | html, Rmd | |
| 9 | 11/22/16 | Ted Laderas: Lecture and Lab combo | Git Repo | |
| 9 | 11/24/16 | Thanksgiving - No Class | ||
| 10 | 11/29/16 | HW presentations; Copyright | ||
| 10 | 12/1/16 | Ethics | Slides | |
| 11 | 12/6/16 | Guest Lecture: Dr. Marie-Pierre Hasne, "Scientific Representations: A Philosophical Perspective" | Slides | |
| 11 | 12/8/16 | Snowpocalypse 2016 | ||
| 12 | 12/13/16 | Final presentations! | ||
| 12 | 12/15/16 | Final Presentations! |
Assignments & Project
There will be regular homework assignments, typically as part of lab sessions. There will also be a final term project; more details about which will be forthcoming.
Assignment 1
Find two example visualizations (one positive, one negative) from your field; explain why you consider them to be positive or negative. Send your examples to Steven (with "[CS631]" in the subject line) by 10/6.
Assignment 2
This assignment has several parts:- Find two example visualizations illustrating both positive and negative use of preattentive features or Gestalt behavior. These can be two additional visualizations, or can be fresh interpretations of your examples from Assignment 1.
Pick a plot that you are currently working on, and discuss why you chose the current format, what tools you are using, and what motivated your choice of format and tool.
Note: there is no "right" or "wrong" answer for this! The purpose of this part of the assigment is to a) give you practice in thinking analytically about visualization, and b) help us learn about what your current visualization practice looks like so that we can tailor our labs and lectures accordingly.
- For Thursday, 10/13: Bring in the data that you are thinking of using for the final project. We will look at it with you during the Thursday lab, so we (and you!) can start thinking about how much data cleaning and wrangling will need to be done.
Parts 1 and 2 should be completed by the start of business Monday, 10/10 (so that we have time to collate everybody's responses before class). Part 3 will be for class on 10/13.
Assignment 3
Pick a journal from your field, and find their submission requirements for figures. Do they specify a file format? Raster vs. vector? Resolution? Colors?
Assignment 4
In week 4's lab session on visualizing distributions, we began working with data from the article by Posid et al., but as we discovered, an hour wasn't nearly enough time to explore that data set. For this assignment, you will continue working with that data. Please prepare the following:
- A prose description of the question you want to answer, comparison you want to facilitate, difference you want to highlight, etc.
- A visualization that addresses that question, comparison, etc., along with an explanation of why you designed it the way you did.
Assignment 5
Find a map that predicts the election! Choose an interesting set of circumstances (e.g. if only Men voted); detail what those circumstances are. How was the data gathered, cleaned and filtered? Was the data manipulation ethically sound?
Discuss how the data was visualized. Did they use a choropleth map? Symbolic map? Was the representation ethically sound?
Assignment 6
An investigator carried out a survey about parents' level of knowledge regarding a variety of disorders, stratified by ethnicity. She comes to you asking for help visualizing the data; while the data set is not particularly large, there are a several different variables at work.
In this assignment, you will develop a scientific question about this data, and then design & build a visualization that addresses that question. The first step (developing the question) is the most important, and will guide the second step. Note that this is real data, so please do not share it with others.
To complete this assignment, prepare three PowerPoint slides, following this structure:
- Briefly describe the scientific question you want to answer
- Briefly describe the goals of your visualization: what relationship/difference/trend/etc. you wish to illuminate, what visual encodings you will use, and so on.
- Your visualization itself
In addition to your slides, please also include an Rmd file (if applicable) containing the code you used to generate your figure.
This assignment is due Tuesday, November 29. We hope to share your results with the original investigator, so please do your best work and try not to be late. :-)
Textbook
We will be drawing material from a wide variety of sources for this course; as such, there is no single, required text book per se. However, we will frequently refer to Nathan Yau's Data Points, and highly recommend that anybody taking this class have a copy. Additionally, many lab sessions and some assignments will use exercises from Nathan Yau's Visualize This.
Resources
Useful books
Visualization
- William Cleveland, The Elements of Graphing Data
- Colin Ware, Information Visualization: Perception for Design
- Stephen Kosslyn, Graph Design for Eye and Mind
- Nathan Yau
- Tamara Munzner, Visualization Analysis and Design
- Stephen Few, Now You See It: Simple Visualization Techniques for Quantitative Analysis
- Alberto Cairo
- Katy Börner, Visual Insights: A Practical Guide to Making Sense of Data
- Joel Katz, Designing Information: Human Factors and Common Sense in Information Design
- Manuel Lima
- Edward Tufte
Related Topics
- Maureen Stone, A Field Guide to Digital Color
- Rudolf Arnheim, Visual Thinking
- Scott McCloud, Understanding Comics: The Invisible Art
Websites of note
- Visualising Data's "Resources" index'
- Matt Brehmer's Monster List Of Resources (from UBC)
- OHSU Communications Office (Graphic Design services, etc.)
- HelpMeViz (crowdsourced data visualization help)
- Blogs:
-
References & Examples
- R Graph Compendia/Catalogs:
- A Compendium of Clean Graphs in R, by Eric-Jan Wagenmakers and Quentin F. Gronau (note: in "Base R")
- R Graph Catalog, by Joanna Zhao and Jennifer Bryan (note: in ggplot2)
- Markdown Tutorial
- Summer 2016 ggplot OHSU Data Jamboree
- A useful tutorial on using the Seaborn Python library for visualizing distributions.
- A Dramatic Tour through Python’s Data Visualization Landscape (including ggplot and Altair)
- The Washington Post's "demographic tug-of-war" visualization is a lovely illustration of how not to appropriately use color saturation and hue to encode information, and also has misleading axes (both in unit spacing and direction)!
- The New York Times' interactive "The 1,024 Ways Clinton or Trump Can Win the Election" is a great use of interactivity as a data exploration tool.
- Also from the NYT, "Your Surgeon Is Probably a Republican, Your Psychiatrist Probably a Democrat" makes excellent use of a graphs and charts to tell a very clear story. Also note their detailed description at the end of the article of how the data were collected!
- The Washington Post's "One Hundred Years of Hurricanes" is a nice example of small-multiples cartography along with color.
- The New York Times' "What Good Marathons and Bad Investments Have in Common" illustrates a good use of contrast and preattentive processing (plus is a very interesting story!).
- From Our World In Data, a nice example of using color and saturation to highlight certain information, in a terrifying plot about Life Expectancy vs. Health Expenditure Over Time.
- Myriahedral map projections are interesting.
- Tilegrams are a good alternative to a cartogram.
- We do not recommend making bivariate chloropleth maps, but if you must, here's a good tutorial on how to do it and what some of the considerations are.
- R Graph Compendia/Catalogs:
-
Resources & Tools:
- ColorBrewer
- Adobe Kuler
- Colorgorical
- Photochrome
- Lyra
- Packages:
- Are we missing a favorite of yours? Let us know!
Additional Readings
Papers
- Brehmer M, Sedlmair M, Ingram S, Munzner T. Visualizing Dimensionally-reduced Data: Interviews with Analysts and a Characterization of Task Sequences. Proc. Beyond Time & Errors: Novel Evaluation Methods For Information Visualization (BELIV) 2014. p. 1–8.
- Borland D, Taylor MR. Rainbow color map (still) considered harmful. IEEE computer graphics and applications. 2007 Mar;27(2):14–7.
- Christensen DL, Baio J, Van Naarden Braun K, Bilder D, Charles J, Constantino JN, et al. Prevalence and Characteristics of Autism Spectrum Disorder Among Children Aged 8 Years--Autism and Developmental Disabilities Monitoring Network, 11 Sites, United States, 2012. MMWR Surveillance summaries : Morbidity and mortality weekly report Surveillance summaries / CDC. 2016 Apr 1;65(3):1–23.
- Cleveland WS, McGill R. Graphical Perception: Theory, Experimentation, and Application to the Development of Graphical Methods. Journal of the American Statistical Association. 1984;79(387):531–54.
- Cleveland WS, Diaconis P, McGill R. Variables on Scatterplots Look More Highly Correlated When the Scales Are Increased. Science; 1982;216(4550):1138–41.
- Dörk M, Feng P, Collins C, Carpendale S. Critical InfoVis: exploring the politics of visualization. Proc. 'CHI 2013.
- Elliott, K. "39 studies about human perception in 30 minutes"; presented at OpenVis 2016.
- Heer J, Bostock M. Crowdsourcing graphical perception: using mechanical turk to assess visualization design. ACM CHI '10; 2010. p. 203–12.
- Kosara R. An Empire Built On Sand: Reexamining What We Think We Know About Visualization. in the Proceedings of the Sixth Workshop on Beyond Time and Errors on Novel Evaluation Methods for Visualization (BELIV '16) 2016. p. 162–8.
- Krzywinski M, Altman N. Points of significance: error bars. Nat Meth. Nature Research; 2013 Oct;10(10):921–2.
- Krzywinski M, Altman N. Visualizing samples with box plots. Nat Meth. 2014 Feb;11(2):119–20.
- Shneiderman B. Research agenda: Visual overviews for exploratory search. Information Seeking Support Systems. 2008;11:4.
- Sedlmair M, Meyer M, Munzner T. Design Study Methodology: Reflections from the Trenches and the Stacks. IEEE Transactions on Visualization and Computer Graphics. 2012 Dec;18(12):2431–40.
- Sedlmair M, Tatu A, Munzner T, Tory M. A Taxonomy of Visual Cluster Separation Factors. Computer Graphics Forum. 2012;31(3pt4):1335–44.
- Sedlmair M, Munzner T, Tory M. Empirical Guidance on Scatterplot and Dimension Reduction Technique Choices. IEEE Transactions on Visualization and Computer Graphics. 2013 Dec;19(12):2634–43.
- Weissgerber TL, Milic NM, Winham SJ, Garovic VD. Beyond bar and line graphs: time for a new data presentation paradigm. PLoS Biol. Public Library of Science; 2015 Apr;13(4):e1002128.
Blog posts, etc.
- The Why Axis's "Mind the Gap: An Economic Chart Remake", by Jon Schwabish
- Notes on the Arabic FedEx logo.
- Jenny Cham's delightful "sketchnotes" from a 2014 seminar by the incomparable Tamara Munzner.
- Randy Olson's illustration of Small Multiples vs. Animated GIFs.
- Visual.ly's Color Emotion Guide
- I am very interested in William Playfair and the history of data visualization:
- Atlas Obscura, The Scottish Scoundrel Who Changed How We See Data
- Lauren Klein, Repairing William Playfair at the MLA
- Georgia Tech's Digital Humanities Lab, Repairing William Playfair
- Neil Richards, When is a visualisation a call to action?
- Carl Zimmer (yes, the Carl Zimmer) on genome graphs: As DNA reveals its secrets, scientists are assembling a new picture of humanity, with numerous examples of creative new ways to visualize genetic variation.
- Ben Jones, "From Simple Tables to Multiple Vizzes": an illustration of ten different ways to visualize the same table. What different stories pop out from the different visualizations?
- Kristoffer Magnusson, How to tell when error bars correspond to a significant p-value
- Kyle Walker, Should you visualize data with a map or a chart? Thoughts from teaching introductory geography
- Lazaro Gamio (Washington Post), Election maps are telling you big lies about small things
- Cartonerd, The NYT election map
- vis4.net, Why we didn’t use a cartogram in the Brexit map
- Benjamin Hennig, Cartogram Special – Brexit
- Tom Pearson (Financial Times), Communicating with data — How the FT explained Brexit: "From early sketch to final dashboard, FT data visualisation experts explain the process"


Access Statement
Our program is committed to all students achieving their potential. If you have a disability or think you may have a disability (physical, learning, hearing, vision, psychological) which may need a reasonable accommodation please contact Student Access at (503) 494-0082 or e-mail studentaccess@ohsu.edu to discuss your needs. You can also find more information at http://www.ohsu.edu/student-access. Because accommodations can take time to implement, it is important to have this discussion as soon as possible. All information regarding a student’s disability is kept in accordance with relevant state and federal laws.
Equity and Inclusion
Oregon Health & Science University is committed to creating and fostering a learning and working environment based on open communication and mutual respect. If you encounter sexual harassment, sexual misconduct, sexual assault, or discrimination based on race, color, religion, age, national origin or ancestry, veteran or military status, sex, marital status, pregnancy or parenting status, sexual orientation, gender identity, disability or any other protected status please contact the Affirmative Action and Equal Opportunity Department at 503-494-5148 or aaeo@ohsu.edu. Inquiries about Title IX compliance or sex/gender discrimination and harassment may be directed to the OHSU Title IX Coordinator at 503-494-0258 or titleix@ohsu.edu.