| Run Tag | Group | Type |
System Description |
| asubaral | arizonau.baral | m | (Not provided.) |
| CCP0 | ucolorado.cohen | m | LocusLink gene synonym expansion; stemming; topic-specific keyword expansion; UMLS for disease synonyms, with heavy manual filtering of synonyms for "cancer"; weighted title over abstract. |
| CCP1 | ucolorado.cohen | m | LocusLink gene synonym expansion, converting all synonyms to a "bag of words", weighting individual words by frequency in synset; stemming; topic-specific keyword expansion; UMLS for disease synonyms, also converted to BOW; weighted title over abstract. |
| dcu1 | dublincityu.gurrin | a | This is the result of pseudo-relevance feedback on a baseline obtained with the DCU CDVP search engine Fisreal. Our search engine implements the BM25 probabilistic algorithm and the pseudo-relevance feedback is using Robertson Offer Weight method. The feedback aims at expanding the original queries with terms related to the generic structure of the queries, i.e. the Generic Topic Templates. The expansion terms were extracted from the sample search results using the relevance judgment provided. |
| dcu2 | dublincityu.gurrin | a | This is the result of pseudo-relevance feedback on a baseline obtained with the DCU CDVP search engine Fisreal. Our search engine implements the BM25 probabilistic algorithm and the pseudo-relevance feedback is using Robertson Offer Weight method. The feedback aims at expanding the original queries with terms related to the generic structure of the queries, i.e. the Generic Topic Templates (GTTs). The top 5 documents for each topic of the same GTT are assumed relevant and GTT-related structure terms are extracted from these documents to expand topics that are instances of that particular GTT. |
| dpsearch1 | datapark.zakharov | m | The DataparkSearch engine of upcoming 4.32 version has been used with fast method and default options of relevancy calculation. |
| dpsearch2 | datapark.zakharov | m | The DataparkSearch engine of upcoming 4.32 version has been used with full method and default options of relevancy calculation. |
| DUTAdHoc1 | dalianu.yang | m | Our ad hoc task retreival system mainly includes the following features gene synonym expansion,medical term expansion based on the Metathesaurus of UMLS Knowledge Sources provided by NLM,different scoring strategy on different parts of Medline record(Title,Abstract,RN,MH,etc.). |
| DUTAdHoc2 | dalianu.yang | m | Our ad hoc task retreival system mainly includes the following features gene synonym expansion,medical term expansion based on the Metathesaurus of UMLS Knowledge Sources provided by NLM,different scoring strategy on different parts of Medline record(Title,Abstract,RN,MH,etc.)and Pseudo-relevant feedback. |
| genome1 | csusm.guillen | a | We used the INDRI system developed by UMASS and CMU to create five indexes. Then we used the "runquery" option to retrieve documents using the five indexes. The topics were mapped to the INDRI format before retrieving the documents. |
| genome2 | csusm.guillen | a | We used the INDRI system developed by UMASS and CMU to create five indexes. Then we used the "runquery" option including the feedback parameter with 100 documents to retrieve documents. The topics were mapped to the INDRI system format before running the queries. |
| i2r1 | iir.yu | a | Automatic of Institute for Infocomm Research. |
| i2r2 | iir.yu | a | The 2nd from Institute for Infocomm Research |
| iasl1 | academia.sinica.tsai | a | Without using query expansion in Template 1. Without relevance feedback. |
| iasl2 | academia.sinica.tsai | a | With query expansion in Template 1 and relevance feedback |
| ibmadz05bs | ibm.zhang | a | Primary run. Enhanced automatic relevance feedback. Synonyms from external resources. Queries enhanced by bi-grams. |
| ibmadz05us | ibm.zhang | a | Secondary run. Enhanced automatic relevance feedback. Synonyms from external resources. |
| iitprf011003 | iit.urbain | a | Modivied pvn with 1 iteration RF. |
| MARYGEN1 | umaryland.oard | a | InQuery with proximity operators for phrases identified using MetaMap and disease name expansion using MetaMap |
| NCBIMAN | nlm.wilbur | m | Same as NCBITHQ for all queries except template 1 (100-109) which used manual theme generation. |
| NCBITHQ | nlm.wilbur | a | Phrases and their variants are extracted from each query and used to form boolean queries. The non-gene resuls are expanded using a "theme" approach (naive Bayes scoring) to rescore the results. Document scores from individual queries are converted to probabilites and combined with fuzzy logic operations. Template 1 uses the MEDLINE nearest neighbor function instead of boolean queries on separate phrases, and combines the results with a generic "protocol theme". |
| NLMfusionA | nlm-umd.aronson | a | combination of four systems NCBI, Smart, InQuery, EZIR with query expansion |
| NLMfusionB | nlm-umd.aronson | a | combination by template of four systems NCBI, Smart, InQuery, EZIR with query expansion |
| NTUgah1 | ntu.chen | a | The Entrez Gene and MeSH databases are used to identify important topic terms and their synonymns. For a topic, documents are first ranked by whether they contain all the important terms, and than by BM25 scores. |
| NTUgah2 | ntu.chen | a | Same as NTUgah1, except that documents which contain all important terms in their abstracts or titles are ranked higher than those which contain important terms appearing only in their MeSH fields. |
| OHSUall | ohsu.hersh | a | Use all words in the narrative topic files. Zettair engine with Okapi k1=0.2 |
| OHSUkey | ohsu.hersh | a | Use only keywords in the narrative topic files. Zettair engine with Okapi k1=0.2 |
| PDnoSE | upadova.bacchin | a | This is a TF-IDF vector based IR system. |
| PDSESe02 | upadova.bacchin | a | The IR system uses a query expansion technique based on symbol recognition. |
| SFUshi | simon-fraseru.shi | m | 1. Make use of public gene/protein database to expand query; 2. Use structured query to express logic relations among query terms; 3. Use pseudo relevance feedback; |
| THUIRgen1S | tsinghua.ma | a | Structural Query Language; UniSentence, BiSentence and Multi-field Retrieval; Internal Resource Utility; Iterative Result Fusion; Stemming, Stopword, BM2500, Pseudo-relevance feedback; (More details will be involved in our report.) |
| THUIRgen2P | tsinghua.ma | a | Pattern Generation; Pattern Matching and Scoring; Prefix, Midfix, and Suffix for Given Template Expansion; Balance Between Precision and Recall; Internal Resource Utility. (More details will be involved in our report.) |
| tnog10 | tno.erasmus.kraaij | a | JM smoothed language model |
| tnog10p | tno.erasmus.kraaij | a | JM smoothed language model, + Journal title prior |
| UAmscombGeFb | uamsterdam.aidteam | a | that combines MeSH-heading based blind feedback with gene name synonym and acronym expansion |
| UAmscombGeMl | uamsterdam.aidteam | a | that combines gene name synonym and acronym expansion with automatic MeSH-heading lookup procedure |
| UBIgeneA | suny-buffalo.ruiz | a | Automatic using gene expansion with MeSH terms, minimal stemming, and restricted word bigrams. IR system SMART, weighting scheme atn.ann |
| UICgen1 | uillinois-chicago.liu | a | Porter stemming; OKAPI; Query expansion; Weighting scheme |
| UIowa05GN101 | uiowa.eichmann | a | Precision focussed run. Uses a more stringent threshold on the ranked results. |
| UIowa05GN102 | uiowa.eichmann | a | Recall focussed run. |
| UIUCgAuto | uiuc.zhai | a | This is produced completely automatically from the original topic description. It performs pseudo feedback based on the structure of the query using a language modeling approach. |
| UIUCgInt | uiuc.zhai | i | This is produced with human relevance judgments on the top 20 documents from the initial retrieval run. It also uses biology resources to automatically expand the original queries. |
| UMD01 | umichigan-dearborn.murphey | a | We extracted key words from each topic and combine keywords with logic connection AND or OR. We then calculated similarity scores of all documents with this combination and sorted the results. |
| UMD02 | umichigan-dearborn.murphey | a | We extracted key words from each topic,then calculated similarity scores by Okapi BM25 method and sorted the results. |
| UniGe2 | u.geneva | a | This runs merges two different lists 1) a with query expansion, based on gene and protein names and rocchio; 2) a with expansion based on MeSH terms. Warning this is intended to replace the 'UniGeC' ! Please, 'UniGeC' is corrupted and should be deleted. |
| UniGeNe | u.geneva | a | Data fusion (combination of two result lists) by a) a probabilistic model + pseudo-relance feedback (10 docs / 20 terms) b) same probabilistic model with modified queries (with thesaurus of gene and protein names) + PRF (10 docs / 20 terms) |
| UniNeHug2 | uneuchatel.savoy | a | Probabilistic model + pseudo-relance feedback (10docs / 20 terms) |
| UniNeHug2c | uneuchatel.savoy | a | Data fusion (combination of two result lists) by a) a probabilistic model + pseudo-relance feedback (10docs / 20 terms) b) same probabilistic model with modified queries (with genomics DB) + PRF (10 docs / 20 terms) |
| uta05a | utampere.pirkola | a | This is a simple that serves as a baseline for our second run. Topic keys were used in queries, no expansion etc. was used. Different columns of a template were linked by a Boolean conjunction. |
| uta05i | utampere.pirkola | i | 1. Synonymous gene names for the topic gene names were retrieved from the Entrez Gene. 2. Our automatic queries (uta05a) were expanded with the synonyms. 3. The expanded queries were on the test database. 4. Final queries (Boolean queries) were formulated by further expanding the queries with MH terms and synonyms found in the top documents of the initial search. |
| uwmtEg05 | uwaterloo.clarke | a | Plain Okapi BM25 run, with stemming applied to all terms that do not contain numerical characters. |
| uwmtEg05fb | uwaterloo.clarke | a | Okapi BM25 with standard Okapi feedback; stemming applied to all terms that do not contain numerical characters. This is a two-stage run, using the top 40 documents returned by the first stage to add pseudo-relevance feedback terms to the query in the second stage. |
| wim1 | fudan.niu | a | language model,greek letter,query expansion |
| wim2 | fudan.niu | a | gene noun,okapi,query expansion |
| YAMAHASHI1 | utokyo.takahashi | m | Using MeSH for ranking. |
| YAMAHASHI2 | utokyo.takahashi | m | Not Using MeSH for ranking. |
| york05ga1 | yorku.huang | a | 1. use Okapi BM25 System with stuctured query function 2. use rules to expand the terms. 3. use BioNLP utility to identify the long form and acronym pairs. 4. use some rules to rebalance the weight for query term. 5. blank feedback with special term selection technique |
| york05gm1 | yorku.huang | m | 1. use Okapi BM25 system with structured query function 2. use Acromed and LocusLink database to expand the terms. 3. mannualy select good quality expanded terms 4. use some rules to rebalance the weight for query term 5. blank feedback with special term selection technique |
| Topic | Pool | Definitely Relevant |
Possibly Relevant |
Not Relevant |
TREC Relevant |
% relevant |
| 100 | 704 | 22 | 52 | 630 | 74 | 10.5% |
| 101 | 651 | 2 | 18 | 631 | 20 | 3.1% |
| 102 | 1164 | 5 | 5 | 1154 | 10 | 0.9% |
| 103 | 701 | 6 | 19 | 676 | 25 | 3.6% |
| 104 | 629 | 0 | 4 | 625 | 4 | 0.6% |
| 105 | 1133 | 4 | 85 | 1044 | 89 | 7.9% |
| 106 | 1230 | 44 | 125 | 1061 | 169 | 13.7% |
| 107 | 484 | 76 | 114 | 294 | 190 | 39.3% |
| 108 | 1092 | 76 | 127 | 889 | 203 | 18.6% |
| 109 | 389 | 165 | 14 | 210 | 179 | 46.0% |
| 110 | 934 | 4 | 12 | 918 | 16 | 1.7% |
| 111 | 675 | 109 | 93 | 473 | 202 | 29.9% |
| 112 | 870 | 4 | 7 | 859 | 11 | 1.3% |
| 113 | 1356 | 10 | 4 | 1342 | 14 | 1.0% |
| 114 | 754 | 210 | 169 | 375 | 379 | 50.3% |
| 115 | 1350 | 3 | 12 | 1335 | 15 | 1.1% |
| 116 | 1265 | 58 | 28 | 1179 | 86 | 6.8% |
| 117 | 1094 | 527 | 182 | 385 | 709 | 64.8% |
| 118 | 937 | 20 | 12 | 905 | 32 | 3.4% |
| 119 | 589 | 42 | 19 | 528 | 61 | 10.4% |
| 120 | 527 | 223 | 122 | 182 | 345 | 65.5% |
| 121 | 422 | 17 | 25 | 380 | 42 | 10.0% |
| 122 | 871 | 19 | 37 | 815 | 56 | 6.4% |
| 123 | 1029 | 5 | 32 | 992 | 37 | 3.6% |
| 124 | 752 | 8 | 53 | 691 | 61 | 8.1% |
| 125 | 1202 | 3 | 8 | 1191 | 11 | 0.9% |
| 126 | 1320 | 190 | 117 | 1013 | 307 | 23.3% |
| 127 | 841 | 1 | 3 | 837 | 4 | 0.5% |
| 128 | 954 | 21 | 53 | 880 | 74 | 7.8% |
| 129 | 987 | 16 | 22 | 949 | 38 | 3.9% |
| 130 | 813 | 9 | 23 | 781 | 32 | 3.9% |
| 131 | 431 | 2 | 40 | 389 | 42 | 9.7% |
| 132 | 531 | 3 | 27 | 501 | 30 | 5.6% |
| 133 | 523 | 0 | 5 | 518 | 5 | 1.0% |
| 134 | 732 | 2 | 9 | 721 | 11 | 1.5% |
| 136 | 853 | 0 | 3 | 850 | 3 | 0.4% |
| 137 | 1129 | 12 | 39 | 1078 | 51 | 4.5% |
| 138 | 501 | 6 | 6 | 489 | 12 | 2.4% |
| 139 | 380 | 15 | 20 | 345 | 35 | 9.2% |
| 140 | 395 | 14 | 15 | 366 | 29 | 7.3% |
| 141 | 520 | 34 | 47 | 439 | 81 | 15.6% |
| 142 | 528 | 151 | 120 | 257 | 271 | 51.3% |
| 143 | 902 | 0 | 4 | 898 | 4 | 0.4% |
| 144 | 1212 | 1 | 1 | 1210 | 2 | 0.2% |
| 145 | 288 | 10 | 22 | 256 | 32 | 11.1% |
| 146 | 825 | 370 | 67 | 388 | 437 | 53.0% |
| 147 | 659 | 0 | 10 | 649 | 10 | 1.5% |
| 148 | 536 | 0 | 11 | 525 | 11 | 2.1% |
| 149 | 1294 | 6 | 17 | 1271 | 23 | 1.8% |
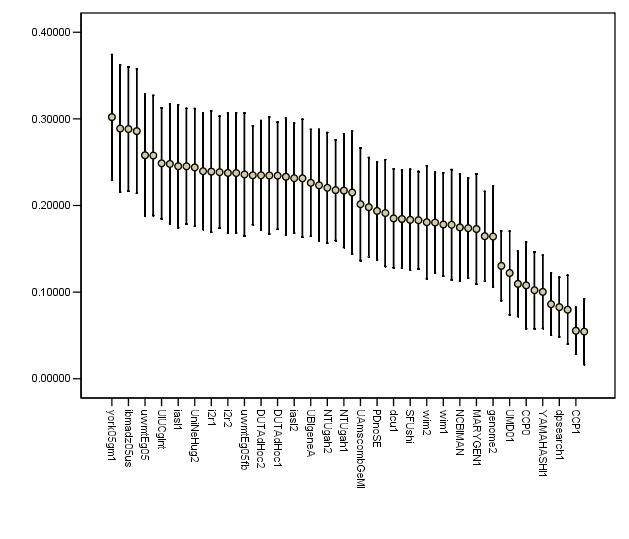
| Run | Type | MAP | R-Prec | B-pref | P10 | P100 | P1000 |
| york05gm1 | m | 0.302 | 0.3212 | 0.3155 | 0.4551 | 0.2543 | 0.0748 |
| york05ga1 | a | 0.2888 | 0.3118 | 0.3061 | 0.4592 | 0.2557 | 0.0721 |
| ibmadz05us | a | 0.2883 | 0.3091 | 0.3026 | 0.4735 | 0.2643 | 0.0766 |
| ibmadz05bs | a | 0.2859 | 0.3061 | 0.2987 | 0.4694 | 0.2606 | 0.0761 |
| uwmtEg05 | a | 0.258 | 0.2853 | 0.2781 | 0.4143 | 0.2292 | 0.0718 |
| UIUCgAuto | a | 0.2577 | 0.2688 | 0.2708 | 0.4122 | 0.231 | 0.0709 |
| UIUCgInt | i | 0.2487 | 0.2627 | 0.267 | 0.4224 | 0.2355 | 0.0694 |
| NLMfusionA | a | 0.2479 | 0.2767 | 0.2675 | 0.402 | 0.2378 | 0.0688 |
| iasl1 | a | 0.2453 | 0.2708 | 0.265 | 0.398 | 0.2292 | 0.0698 |
| NLMfusionB | a | 0.2453 | 0.2666 | 0.2541 | 0.4082 | 0.2339 | 0.0693 |
| UniNeHug2 | a | 0.2439 | 0.2582 | 0.264 | 0.398 | 0.2308 | 0.0712 |
| UniGe2 | a | 0.2396 | 0.2705 | 0.2608 | 0.3878 | 0.2361 | 0.0711 |
| i2r1 | a | 0.2391 | 0.2629 | 0.2716 | 0.3898 | 0.231 | 0.0668 |
| uta05a | a | 0.2385 | 0.2638 | 0.2546 | 0.4163 | 0.2255 | 0.0678 |
| i2r2 | a | 0.2375 | 0.2622 | 0.272 | 0.3878 | 0.2296 | 0.067 |
| UniNeHug2c | a | 0.2375 | 0.2662 | 0.2589 | 0.3878 | 0.239 | 0.0725 |
| uwmtEg05fb | a | 0.2359 | 0.2573 | 0.2552 | 0.3878 | 0.2257 | 0.0712 |
| DUTAdHoc2 | m | 0.2349 | 0.2678 | 0.2725 | 0.3939 | 0.2206 | 0.0648 |
| THUIRgen1S | a | 0.2349 | 0.2663 | 0.2568 | 0.4224 | 0.2214 | 0.0622 |
| tnog10 | a | 0.2346 | 0.2607 | 0.2564 | 0.3857 | 0.2227 | 0.0668 |
| DUTAdHoc1 | m | 0.2344 | 0.2718 | 0.2726 | 0.402 | 0.22 | 0.0645 |
| tnog10p | a | 0.2332 | 0.2506 | 0.2555 | 0.402 | 0.2173 | 0.0668 |
| iasl2 | a | 0.2315 | 0.2465 | 0.2487 | 0.3816 | 0.2276 | 0.07 |
| UAmscombGeFb | a | 0.2314 | 0.2638 | 0.2592 | 0.4163 | 0.2271 | 0.0612 |
| UBIgeneA | a | 0.2262 | 0.2567 | 0.2542 | 0.3633 | 0.2122 | 0.0683 |
| OHSUkey | a | 0.2233 | 0.2569 | 0.2544 | 0.3735 | 0.2169 | 0.0632 |
| NTUgah2 | a | 0.2204 | 0.2562 | 0.2498 | 0.398 | 0.1996 | 0.0644 |
| THUIRgen2P | a | 0.2177 | 0.2519 | 0.2395 | 0.4143 | 0.2198 | 0.0695 |
| NTUgah1 | a | 0.2173 | 0.2558 | 0.2513 | 0.3918 | 0.1998 | 0.0615 |
| UniGeNe | a | 0.215 | 0.2364 | 0.2347 | 0.3367 | 0.2237 | 0.0694 |
| UAmscombGeMl | a | 0.2015 | 0.2325 | 0.232 | 0.3551 | 0.2094 | 0.0568 |
| uta05i | i | 0.198 | 0.2411 | 0.229 | 0.4082 | 0.2137 | 0.0547 |
| PDnoSE | a | 0.1937 | 0.2213 | 0.2183 | 0.3571 | 0.2006 | 0.063 |
| iitprf011003 | a | 0.1913 | 0.2142 | 0.2205 | 0.3612 | 0.2018 | 0.065 |
| dcu1 | a | 0.1851 | 0.2178 | 0.2129 | 0.3816 | 0.1851 | 0.0577 |
| dcu2 | a | 0.1844 | 0.2234 | 0.214 | 0.3959 | 0.1896 | 0.0599 |
| SFUshi | m | 0.1834 | 0.2072 | 0.2149 | 0.3429 | 0.1898 | 0.0608 |
| OHSUall | a | 0.183 | 0.2285 | 0.2221 | 0.3286 | 0.1965 | 0.0592 |
| wim2 | a | 0.1807 | 0.2006 | 0.2055 | 0.3 | 0.1794 | 0.057 |
| genome1 | a | 0.1803 | 0.2174 | 0.211 | 0.3245 | 0.1749 | 0.0577 |
| wim1 | a | 0.1781 | 0.2094 | 0.2076 | 0.3347 | 0.181 | 0.0592 |
| NCBITHQ | a | 0.1777 | 0.214 | 0.2192 | 0.3041 | 0.1824 | 0.0526 |
| NCBIMAN | m | 0.1747 | 0.2081 | 0.2181 | 0.3122 | 0.182 | 0.0519 |
| UICgen1 | a | 0.1738 | 0.2079 | 0.2046 | 0.3082 | 0.1941 | 0.0579 |
| MARYGEN1 | a | 0.1729 | 0.1954 | 0.1898 | 0.3041 | 0.1439 | 0.0409 |
| PDSESe02 | a | 0.1646 | 0.1928 | 0.1928 | 0.3224 | 0.1904 | 0.0615 |
| genome2 | a | 0.1642 | 0.1931 | 0.1928 | 0.298 | 0.1676 | 0.0565 |
| UIowa05GN102 | a | 0.1303 | 0.1861 | 0.1693 | 0.2898 | 0.1671 | 0.0396 |
| UMD01 | a | 0.1221 | 0.1541 | 0.1435 | 0.3224 | 0.1473 | 0.0321 |
| UIowa05GN101 | a | 0.1095 | 0.1636 | 0.1414 | 0.2857 | 0.1571 | 0.026 |
| CCP0 | m | 0.1078 | 0.1486 | 0.1311 | 0.2837 | 0.1439 | 0.0203 |
| YAMAHASHI2 | m | 0.1022 | 0.1236 | 0.1276 | 0.2653 | 0.1312 | 0.0369 |
| YAMAHASHI1 | m | 0.1003 | 0.1224 | 0.1248 | 0.2531 | 0.1267 | 0.0356 |
| dpsearch2 | m | 0.0861 | 0.1169 | 0.1034 | 0.2633 | 0.1231 | 0.0278 |
| dpsearch1 | m | 0.0827 | 0.1177 | 0.1017 | 0.2551 | 0.1182 | 0.0274 |
| asubaral | m | 0.0797 | 0.1079 | 0.0967 | 0.2714 | 0.1061 | 0.0142 |
| CCP1 | m | 0.0554 | 0.0963 | 0.0775 | 0.1878 | 0.0951 | 0.0134 |
| UMD02 | a | 0.0544 | 0.0703 | 0.0735 | 0.1755 | 0.0843 | 0.0166 |
| Topic | MAP | R-Prec | B-Pref | P10 | P100 | P1000 |
| 100 | 0.1691 | 0.2148 | 0.1616 | 0.3569 | 0.1916 | 0.0550 |
| 101 | 0.0454 | 0.0526 | 0.0285 | 0.0483 | 0.0516 | 0.0141 |
| 102 | 0.0110 | 0.0172 | 0.0100 | 0.0172 | 0.0091 | 0.0036 |
| 103 | 0.0603 | 0.0945 | 0.0570 | 0.0948 | 0.0602 | 0.0169 |
| 104 | 0.0694 | 0.0948 | 0.0582 | 0.0690 | 0.0124 | 0.0023 |
| 105 | 0.1102 | 0.1703 | 0.1461 | 0.4655 | 0.1586 | 0.0327 |
| 106 | 0.0625 | 0.1120 | 0.1231 | 0.3138 | 0.1433 | 0.0491 |
| 107 | 0.4184 | 0.4297 | 0.5289 | 0.9103 | 0.5934 | 0.1373 |
| 108 | 0.1224 | 0.1973 | 0.2206 | 0.4828 | 0.2788 | 0.0695 |
| 109 | 0.5347 | 0.5196 | 0.6512 | 0.9190 | 0.7066 | 0.1345 |
| 110 | 0.0137 | 0.0248 | 0.0154 | 0.0224 | 0.0128 | 0.0055 |
| 111 | 0.2192 | 0.2985 | 0.2926 | 0.3569 | 0.3140 | 0.1170 |
| 112 | 0.2508 | 0.3354 | 0.2754 | 0.3586 | 0.0481 | 0.0062 |
| 113 | 0.3124 | 0.3498 | 0.3164 | 0.3931 | 0.0822 | 0.0096 |
| 114 | 0.3876 | 0.4364 | 0.5505 | 0.8259 | 0.6697 | 0.2476 |
| 115 | 0.0378 | 0.0437 | 0.0340 | 0.0534 | 0.0193 | 0.0036 |
| 116 | 0.1103 | 0.1720 | 0.1456 | 0.2879 | 0.1636 | 0.0359 |
| 117 | 0.3796 | 0.4739 | 0.5126 | 0.8345 | 0.7409 | 0.4099 |
| 118 | 0.1343 | 0.1460 | 0.1369 | 0.3276 | 0.0634 | 0.0145 |
| 119 | 0.5140 | 0.5212 | 0.5075 | 0.8190 | 0.3462 | 0.0493 |
| 120 | 0.5769 | 0.5421 | 0.7217 | 0.9259 | 0.8091 | 0.2695 |
| 121 | 0.6205 | 0.6560 | 0.6394 | 0.7983 | 0.3040 | 0.0337 |
| 122 | 0.1423 | 0.2023 | 0.1590 | 0.3569 | 0.1510 | 0.0320 |
| 123 | 0.0375 | 0.0708 | 0.0474 | 0.1121 | 0.0493 | 0.0133 |
| 124 | 0.1519 | 0.2035 | 0.1693 | 0.5103 | 0.1505 | 0.0324 |
| 125 | 0.0772 | 0.0862 | 0.0708 | 0.0897 | 0.0209 | 0.0028 |
| 126 | 0.1313 | 0.2172 | 0.2388 | 0.3966 | 0.2979 | 0.1422 |
| 127 | 0.1015 | 0.1250 | 0.0862 | 0.0759 | 0.0155 | 0.0028 |
| 128 | 0.0921 | 0.1424 | 0.1062 | 0.3224 | 0.1247 | 0.0366 |
| 129 | 0.0864 | 0.1393 | 0.0939 | 0.1793 | 0.0984 | 0.0212 |
| 130 | 0.3390 | 0.3545 | 0.3346 | 0.6362 | 0.1388 | 0.0194 |
| 131 | 0.4436 | 0.4384 | 0.4230 | 0.5517 | 0.2790 | 0.0343 |
| 132 | 0.1048 | 0.1558 | 0.1115 | 0.2431 | 0.0966 | 0.0196 |
| 133 | 0.0328 | 0.0207 | 0.0172 | 0.0172 | 0.0140 | 0.0029 |
| 134 | 0.1687 | 0.1771 | 0.1582 | 0.1914 | 0.0364 | 0.0069 |
| 136 | 0.0032 | 0.0000 | 0.0000 | 0.0000 | 0.0019 | 0.0010 |
| 137 | 0.0676 | 0.1146 | 0.0767 | 0.1776 | 0.0848 | 0.0232 |
| 138 | 0.2196 | 0.2342 | 0.2029 | 0.2534 | 0.0552 | 0.0089 |
| 139 | 0.3600 | 0.3941 | 0.3488 | 0.5810 | 0.2052 | 0.0305 |
| 140 | 0.2700 | 0.3115 | 0.2423 | 0.3810 | 0.1843 | 0.0248 |
| 141 | 0.2381 | 0.2735 | 0.2053 | 0.3362 | 0.2598 | 0.0699 |
| 142 | 0.4416 | 0.4608 | 0.5911 | 0.8569 | 0.6409 | 0.2098 |
| 143 | 0.0031 | 0.0043 | 0.0011 | 0.0034 | 0.0021 | 0.0009 |
| 144 | 0.0734 | 0.0603 | 0.0431 | 0.0276 | 0.0053 | 0.0009 |
| 145 | 0.3363 | 0.3761 | 0.3238 | 0.5931 | 0.1852 | 0.0260 |
| 146 | 0.4808 | 0.4961 | 0.6325 | 0.8466 | 0.7212 | 0.3076 |
| 147 | 0.0087 | 0.0138 | 0.0057 | 0.0138 | 0.0091 | 0.0040 |
| 148 | 0.0411 | 0.0376 | 0.0144 | 0.0293 | 0.0407 | 0.0066 |
| 149 | 0.0286 | 0.0495 | 0.0304 | 0.0603 | 0.0347 | 0.0089 |
| Topics | Pool | Definitely Relevant |
Possibly Relevant |
Not Relevant |
TREC Relevant |
% relevant |
| 100-109 | 817.7 | 40.0 | 56.3 | 721.4 | 96.3 | 14.4% |
| 110-119 | 982.4 | 98.7 | 53.8 | 829.9 | 152.5 | 17.1% |
| 120-129 | 890.5 | 50.3 | 47.2 | 793.0 | 97.5 | 13.0% |
| 130-139 | 654.8 | 5.4 | 19.1 | 630.2 | 24.6 | 4.3% |
| 140-149 | 715.9 | 58.6 | 31.4 | 625.9 | 90.0 | 14.4% |
| Topics |
MAP | R-Prec | B-Pref | P10 | P100 | P1000 |
| 100-109 | 0.1603 | 0.1903 | 0.1985 | 0.3678 | 0.2206 | 0.0515 |
| 110-119 | 0.2360 | 0.2802 | 0.2787 | 0.4279 | 0.2460 | 0.0899 |
| 120-129 | 0.2018 | 0.2385 | 0.2333 | 0.3767 | 0.2021 | 0.0587 |
| 130-139 | 0.1932 | 0.2099 | 0.1859 | 0.2946 | 0.1013 | 0.0163 |
| 140-149 | 0.1922 | 0.2084 | 0.2090 | 0.3148 | 0.2083 | 0.0659 |
| Duplicate - Relelvant | Duplicate - Not relevant |
Total |
|
| Original - Relevant | 1100 | 629 | 1729 |
| Original - Not relevant |
546 | 8204 | 8750 |
| Total |
1646 | 8833 | 10479 |
| Run | MAP | AND | OR |
| york05gm1 | 0.302 | 0.3221 | 0.3257 |
| york05ga1 | 0.2888 | 0.3081 | 0.3099 |
| ibmadz05us | 0.2883 | 0.3054 | 0.3121 |
| ibmadz05bs | 0.2859 | 0.3087 | 0.3141 |
| uwmtEg05 | 0.258 | 0.2767 | 0.2778 |
| UIUCgAuto | 0.2577 | 0.2765 | 0.2795 |
| UIUCgInt | 0.2487 | 0.2656 | 0.2675 |
| NLMfusionA | 0.2479 | 0.2701 | 0.2709 |
| iasl1 | 0.2453 | 0.2666 | 0.2678 |
| NLMfusionB | 0.2453 | 0.2711 | 0.272 |
| UniNeHug2 | 0.2439 | 0.261 | 0.2643 |
| UniGe2 | 0.2396 | 0.2655 | 0.2646 |
| i2r1 | 0.2391 | 0.2614 | 0.2615 |
| uta05a | 0.2385 | 0.2557 | 0.2565 |
| i2r2 | 0.2375 | 0.254 | 0.2534 |
| UniNeHug2c | 0.2375 | 0.2621 | 0.2632 |
| uwmtEg05fb | 0.2359 | 0.2601 | 0.2638 |
| DUTAdHoc2 | 0.2349 | 0.2546 | 0.2525 |
| THUIRgen1S | 0.2349 | 0.2514 | 0.2522 |
| tnog10 | 0.2346 | 0.2552 | 0.2559 |
| DUTAdHoc1 | 0.2344 | 0.2533 | 0.2511 |
| tnog10p | 0.2332 | 0.2532 | 0.254 |
| iasl2 | 0.2315 | 0.2499 | 0.2535 |
| UAmscombGeFb | 0.2314 | 0.2577 | 0.2569 |
| UBIgeneA | 0.2262 | 0.2452 | 0.2467 |
| OHSUkey | 0.2233 | 0.2474 | 0.2478 |
| NTUgah2 | 0.2204 | 0.2465 | 0.2441 |
| THUIRgen2P | 0.2177 | 0.2355 | 0.2372 |
| NTUgah1 | 0.2173 | 0.2385 | 0.2361 |
| UniGeNe | 0.215 | 0.2362 | 0.2386 |
| UAmscombGeMl | 0.2015 | 0.2233 | 0.2231 |
| uta05i | 0.198 | 0.2135 | 0.2148 |
| PDnoSE | 0.1937 | 0.2095 | 0.2103 |
| iitprf011003 | 0.1913 | 0.2128 | 0.2113 |
| dcu1 | 0.1851 | 0.203 | 0.2019 |
| dcu2 | 0.1844 | 0.2007 | 0.2001 |
| SFUshi | 0.1834 | 0.191 | 0.1943 |
| OHSUall | 0.183 | 0.2002 | 0.2014 |
| wim2 | 0.1807 | 0.2005 | 0.2015 |
| genome1 | 0.1803 | 0.2033 | 0.2015 |
| wim1 | 0.1781 | 0.1977 | 0.1971 |
| NCBITHQ | 0.1777 | 0.1858 | 0.1885 |
| NCBIMAN | 0.1747 | 0.1831 | 0.1858 |
| UICgen1 | 0.1738 | 0.1968 | 0.1948 |
| MARYGEN1 | 0.1729 | 0.1785 | 0.1804 |
| PDSESe02 | 0.1646 | 0.1782 | 0.1805 |
| genome2 | 0.1642 | 0.1842 | 0.1828 |
| UIowa05GN102 | 0.1303 | 0.1391 | 0.1396 |
| UMD01 | 0.1221 | 0.1293 | 0.1288 |
| UIowa05GN101 | 0.1095 | 0.1167 | 0.1171 |
| CCP0 | 0.1078 | 0.1121 | 0.1125 |
| YAMAHASHI2 | 0.1022 | 0.1055 | 0.1047 |
| YAMAHASHI1 | 0.1003 | 0.104 | 0.1032 |
| dpsearch2 | 0.0861 | 0.1005 | 0.0995 |
| dpsearch1 | 0.0827 | 0.0978 | 0.0971 |
| asubaral | 0.0797 | 0.0846 | 0.0832 |
| CCP1 | 0.0554 | 0.0548 | 0.0555 |
| UMD02 | 0.0544 | 0.0548 | 0.0551 |
| Tag | Group | Prec | Recall | Fscore | Utility | Description |
| aibmadz05s | ibm.zhang | 0.4669 | 0.9337 | 0.6225 | 0.871 | Single classifiers. |
| ABBR003SThr | ibm.kanungo | 0.4062 | 0.9458 | 0.5683 | 0.8645 | Allele task, First, use bayesian regression with full text representation and MH_Mesh check. Second, use output from SVM for sanity check. |
| ABBR003 | ibm.kanungo | 0.3686 | 0.9548 | 0.5319 | 0.8586 | Allele task, using bayesian regression with full text representation and MH_Mesh check. |
| aibmadz05m1 | ibm.zhang | 0.5076 | 0.9006 | 0.6493 | 0.8492 | Combined classifiers with probability thresholding. |
| aibmadz05m2 | ibm.zhang | 0.5025 | 0.9006 | 0.6451 | 0.8482 | Combined classifiers with cross-validation thresholding. |
| cuhkrun3A | cuhk.lam | 0.3442 | 0.9548 | 0.506 | 0.8478 | Customized learning by exploiting the symmetric property of attributes and instances with all features. |
| THUIRgenA1p1 | tsinghua.ma | 0.4902 | 0.9006 | 0.6348 | 0.8455 | Baseline run. Only distanced bigram features. |
| cuhkrun2A | cuhk.lam | 0.3316 | 0.9578 | 0.4926 | 0.8443 | Customized learning by exploiting the symmetric property of attributes and instances. |
| aFduMarsII | fudan.niu | 0.4195 | 0.9187 | 0.576 | 0.8439 | Porter Stemmer, Pubmed Stopword, Certain Domain Retrieval Otherness Model, SVM, specified feature |
| aNTUMAC | ntu.chen | 0.3439 | 0.9488 | 0.5048 | 0.8423 | Mesh30+Caption10+Abstract10+CaptionSEM10+AbstractSEM10 |
| aFduMarsI | fudan.niu | 0.4754 | 0.9006 | 0.6223 | 0.8421 | Porter Stemmer, Pubmed Stopword, Certain Domain Retrieval Otherness Model, SVM |
| ASVMN03 | ibm.kanungo | 0.4019 | 0.9127 | 0.558 | 0.8327 | Allele task, use support vector machine with full text representation (tuned threshold) and MH_Mesh check. |
| aNLMB | nlm-umd.aronson | 0.3391 | 0.9398 | 0.4984 | 0.832 | Mixture |
| aDIMACSl9w | rutgers.dayanik | 0.4357 | 0.8976 | 0.5866 | 0.8292 | Fulltext obtained from journal articles' subject, title, abstract and body fields were used for document representation. Text representation stemmed, logtf-idf, cosine normalization. A classifier, Bayesian Binary Regression (BBR) with Laplace prior, was trained, and used to make predictions with maximum expected effectiveness threshold tuning. |
| THUIRgA0p9x | tsinghua.ma | 0.5414 | 0.8675 | 0.6667 | 0.8242 | CV version. |
| cuhkrun1 | cuhk.lam | 0.3257 | 0.9367 | 0.4833 | 0.8226 | Automatic classification using context feature engineering and context association. |
| aDIMACSg9md | rutgers.dayanik | 0.4509 | 0.8855 | 0.5976 | 0.8221 | Article title, abstract and MEDLINE MeSH terms were used for document representation. Text representation stemmed, logtf-idf, cosine normalization. A classifier, Bayesian Binary Regression (BBR) with Gaussian prior, was trained and used to make predictions with maximum expected effectiveness threshold tuning. |
| aDIMACSl9md | rutgers.dayanik | 0.3844 | 0.9066 | 0.5399 | 0.8212 | Fulltext obtained from journal articles' subject, title, abstract and body fields were used for document representation. Text representation stemmed, logtf-idf, cosine normalization. A classifier, Bayesian Binary Regression (BBR) with Laplace prior, was trained, and used to make predictions with maximum expected effectiveness threshold tuning. |
| aDIMACSg9w | rutgers.dayanik | 0.4882 | 0.8705 | 0.6255 | 0.8168 | Fulltext obtained from journal articles' subject, title, abstract and body fields were used for document representation. Text representation stemmed, logtf-idf, cosine normalization. A classifier, Bayesian Binary Regression (BBR) with Gaussian prior, was trained, and used to make predictions with maximum expected effectiveness threshold tuning. |
| NLM2A | nlm-umd.aronson | 0.4332 | 0.8795 | 0.5805 | 0.8118 | ML methods |
| AOHSUVP | ohsu.hersh | 0.3556 | 0.8976 | 0.5094 | 0.8019 | abstract title, word, MeSH, and gene tokens Chi-square feature selection Voting perceptron classifier |
| aFduMarsIII | fudan.niu | 0.3254 | 0.9096 | 0.4794 | 0.7987 | Porter Stemmer, Pubmed Stopword, MeSH Tree Extracted Knowledge, Rocchio |
| aDUTCat1 | dalianu.yang | 0.2858 | 0.9307 | 0.4374 | 0.7939 | Titles, absracts, bodies are used to represent the documents, backspace-separated words as features, a svm classifier and set weights using tfidf. All texts are processed with A Biomedical Named Entity Recognizer(abner). |
| AOHSUSL | ohsu.hersh | 0.3448 | 0.8765 | 0.4949 | 0.7785 | abstract title, word, MeSH, and gene tokens Chi-square feature selection Slipper2 classifier |
| aQUT14 | queensu.shatkay | 0.3582 | 0.8675 | 0.507 | 0.776 | The probabilistic approach was used for creating probabilistic models of thematic clusters of all the irrelevant documents first, and the resulting thematic clusters were then used for classification into "in"/"out" with respect to Allele category. |
| AOHSUBF | ohsu.hersh | 0.3007 | 0.8976 | 0.4505 | 0.7748 | abstract title, word, MeSH, and gene tokens Chi-square feature selection Best-single feature classifier |
| aIBMIRLrul | ibm-india.ramakrishnan | 0.3185 | 0.8855 | 0.4685 | 0.7741 | applying rules (mesh term and class specific term in medline record), formed using the training set, on the document set obtained after MH - Mice screening |
| Ameta | uwisconsin.craven | 0.3031 | 0.8946 | 0.4527 | 0.7736 | for each document, the posterior probabilites of individiual paragraphs -- as assigned by a primary maximum entropy classifier -- are tallied as a distribution, which is then classified by a secondary maxent classifier |
| Apars | uwisconsin.craven | 0.2601 | 0.9277 | 0.4063 | 0.7725 | averaging the posterior probabilities of selected individual paragraphs as assigned by a maximum entropy classifier trained on full documents |
| aIBMIRLsvm | ibm-india.ramakrishnan | 0.2982 | 0.8946 | 0.4473 | 0.7707 | classifying using SVM of documents (vectors mesh terms + class specific terms using the dic file) obtained after MH - Mice screening |
| aDUTCat2 | dalianu.yang | 0.262 | 0.9217 | 0.408 | 0.769 | Titles, absracts, bodies are used to represent the documents, backspace-separated words as features, a svm classifier and set weights using tfidf. |
| aMUSCUIUC3 | uiuc.zhai | 0.4281 | 0.8072 | 0.5595 | 0.7438 | This is triageA task with SVM classification with semantic features and augmented training cases. |
| Afull | uwisconsin.craven | 0.2718 | 0.8825 | 0.4156 | 0.7434 | bag-of-words maximum entropy classifier |
| aMUSCUIUC2 | uiuc.zhai | 0.5501 | 0.7771 | 0.6442 | 0.7397 | This is triageA task with SVM classification with semantic features |
| aQUNB8 | queensu.shatkay | 0.3182 | 0.8464 | 0.4626 | 0.7397 | The probabilistic approach was used for creating probabilistic models of thematic clusters of all the irrelevant documents first, and the feature selection was done on each resulting thematic cluster. The selected features were used for the classification into "in"/"out" with respect to Allele category. |
| aIBMIRLmet | ibm-india.ramakrishnan | 0.32 | 0.8434 | 0.464 | 0.738 | classifying using SVM the document set obtained as positive after the rules (vectors mesh terms + class specific terms using the dic file). |
| ABPLUS | erasmus.kors | 0.241 | 0.8916 | 0.3795 | 0.7264 | Abstract plus mesh headings plus chemicals |
| aUCHSCnb1En3 | ucolorado.cohen | 0.508 | 0.7651 | 0.6106 | 0.7215 | Categorized based on select bigrams, extracted strain names, and mesh terms. Classifications performed with NaiveBayes. More strict feature selection. |
| aQUT11 | queensu.shatkay | 0.3785 | 0.7741 | 0.5084 | 0.6993 | The probabilistic approach was used for creating probabilistic models of thematic clusters of all the irrelevant documents first, and the resulting thematic clusters were then used for classification into "in"/"out" with respect to Allele category. |
| aUCHSCnb1En4 | ucolorado.cohen | 0.6091 | 0.6476 | 0.6277 | 0.6231 | Categorized based on select bigrams, extracted strain names, and mesh terms. Classifications performed with NaiveBayes. Less strict feature selection. |
| aMUSCUIUC1 | uiuc.zhai | 0.6678 | 0.6054 | 0.6351 | 0.5877 | This is triageA task with basic SVM classification |
| aUCHSCsvm | ucolorado.cohen | 0.7957 | 0.4458 | 0.5714 | 0.4391 | Categorized based on select bigrams, extracted strain names, and mesh terms. Classifications performed with Support Vector Machine. |
| aNLMF | nlm-umd.aronson | 0.2219 | 0.5301 | 0.3129 | 0.4208 | Voting |
| LPC6 | langpower.yang | 0.4281 | 0.4307 | 0.4294 | 0.3969 | System built using rule-based NLP parsing and concept-based indexing. |
| FTA | erasmus.kors | 0.3562 | 0.3916 | 0.373 | 0.3499 | Fulltext A |
| aLRIk1 | uparis-sud.kodratoff | 0.2331 | 0.259 | 0.2454 | 0.2089 | Automatic |
| aLRIk3 | uparis-sud.kodratoff | 0.2191 | 0.262 | 0.2387 | 0.2071 | Automatic + rap + list. |
| aLRIk2 | uparis-sud.kodratoff | 0.2306 | 0.25 | 0.2399 | 0.2009 | Automatic + list. |
| Minimum | 0.2191 | 0.25 | 0.2387 | 0.2009 | ||
| Median | 0.3572 | 0.8931 | 0.5065 | 0.7773 | ||
| Maximum | 0.7957 | 0.9578 | 0.6667 | 0.871 |
| Tag | Group | Prec | Recall | Fscore | Utility | Description |
| eFduMarsI | fudan.niu | 0.1899 | 0.9333 | 0.3156 | 0.8711 | Porter Stemmer, Pubmed Stopword, Certain Domain Retrieval Otherness Model, SVM |
| eFduMarsII | fudan.niu | 0.1899 | 0.9333 | 0.3156 | 0.8711 | Porter Stemmer, Pubmed Stopword, Certain Domain Retrieval Otherness Model, SVM, specified feature |
| eDUTCat1 | dalianu.yang | 0.1364 | 0.9429 | 0.2383 | 0.8496 | Titles, absracts, bodies are used to represent the documents, only nouns as features, a svm classifier and set weights using tfidf. All texts are processed with A Biomedical Named Entity Recognizer(abner). |
| eDIMACSl9w | rutgers.dayanik | 0.2026 | 0.9048 | 0.331 | 0.8491 | Fulltext obtained from journal articles' subject, title, abstract and body fields were used for document representation. Text representation stemmed, logtf-idf, cosine normalization. A classifier, Bayesian Binary Regression (BBR) with Laplace prior, was trained, and used to make predictions with maximum expected effectiveness threshold tuning. |
| eibmadz05s | ibm.zhang | 0.1437 | 0.9333 | 0.249 | 0.8464 | Single classifiers. |
| eibmadz05m2 | ibm.zhang | 0.2109 | 0.8857 | 0.3407 | 0.8339 | Combined classifiers with cross-validation thresholding. |
| cuhkrun2E | cuhk.lam | 0.126 | 0.9333 | 0.222 | 0.8321 | Customized learning by exploiting the symmetric property of attributes and instances. |
| cuhkrun3E | cuhk.lam | 0.1481 | 0.9143 | 0.255 | 0.8321 | Customized learning by exploiting the symmetric property of attributes and instances with all features. |
| EBBR0006SThr | ibm.kanungo | 0.1228 | 0.9333 | 0.2171 | 0.8292 | Expression task, First use bayesian regression with full text representation (tuned threshold) and MH_Mesh check. Second, use output from SVM for sanity check. |
| THUIRgenE1p8 | tsinghua.ma | 0.1322 | 0.9238 | 0.2312 | 0.829 | Baseline run. Only distanced bigram features. |
| eibmadz05m1 | ibm.zhang | 0.2201 | 0.8762 | 0.3518 | 0.8277 | Combined classifiers with probability thresholding. |
| EBBR0006 | ibm.kanungo | 0.1211 | 0.9333 | 0.2144 | 0.8275 | Expression task, use bayesian regression with full text representation (tuned threshold) and MH_Mesh check. |
| eDUTCat2 | dalianu.yang | 0.1104 | 0.9429 | 0.1976 | 0.8241 | Titles, absracts, bodies are used to represent the documents, backspace-separated words as features, a svm classifier and set weights using tfidf. |
| ESVMN075 | ibm.kanungo | 0.1265 | 0.9143 | 0.2222 | 0.8156 | Expression task, use support vector machine with full text representation (tuned threshold) and MH_Mesh check. |
| cuhkrun1E | cuhk.lam | 0.1119 | 0.9143 | 0.1994 | 0.8009 | Automatic classification using context feature engineering and context association. |
| eDIMACSg9w | rutgers.dayanik | 0.2444 | 0.8381 | 0.3785 | 0.7976 | Fulltext obtained from journal articles' subject, title, abstract and body fields were used for document representation. Text representation stemmed, logtf-idf, cosine normalization. A classifier, Bayesian Binary Regression (BBR) with Gaussian prior, was trained, and used to make predictions with maximum expected effectiveness threshold tuning. |
| eFduMarsIII | fudan.niu | 0.0794 | 0.9524 | 0.1466 | 0.7799 | Porter Stemmer, Pubmed Stopword, MeSH Tree Extracted Knowledge, Rocchio |
| eNTUMAC | ntu.chen | 0.1593 | 0.819 | 0.2667 | 0.7515 | Mesh10+Caption10+CaptionSEM10 |
| Epars | uwisconsin.craven | 0.0818 | 0.8857 | 0.1498 | 0.7304 | averaging the posterior probabilities of selected individual paragraphs as assigned by a maximum entropy classifier trained on full documents |
| eIBMIRLsvm | ibm-india.ramakrishnan | 0.0571 | 0.9238 | 0.1075 | 0.6854 | classifying using SVM of documents (vectors mesh terms + class specific terms using the dic file) obtained after MH - Mice screening |
| ABPLUSE | erasmus.kors | 0.0841 | 0.819 | 0.1525 | 0.6796 | Abstracts plus mesh headings plus chemicals E |
| eDIMACSg9md | rutgers.dayanik | 0.1575 | 0.7333 | 0.2593 | 0.672 | Article title, abstract and MEDLINE MeSH terms were used for document representation. Text representation stemmed, logtf-idf, cosine normalization. A classifier, Bayesian Binary Regression (BBR) with Gaussian prior, was trained and used to make predictions with maximum expected effectiveness threshold tuning. |
| Emeta | uwisconsin.craven | 0.1273 | 0.7333 | 0.2169 | 0.6548 | for each document, the posterior probabilites of individiual paragraphs -- as assigned by a primary maximum entropy classifier -- are tallied as a distribution, which is then classified by a secondary maxent classifier |
| eDIMACSl9md | rutgers.dayanik | 0.1054 | 0.7238 | 0.184 | 0.6278 | Article title, abstract and MEDLINE MeSH terms were used for document representation. Text representation stemmed, logtf-idf, cosine normalization. A classifier, Bayesian Binary Regression (BBR) with Laplace prior, was trained and used to make predictions with maximum expected effectiveness threshold tuning. |
| NLM2E | nlm-umd.aronson | 0.2863 | 0.6381 | 0.3953 | 0.6132 | ML methods |
| EOHSUBF | ohsu.hersh | 0.0405 | 0.9619 | 0.0777 | 0.6058 | abstract title, word, MeSH, and gene tokens Chi-square feature selection Best-single feature classifier |
| Efull | uwisconsin.craven | 0.0636 | 0.781 | 0.1176 | 0.6012 | bag-of-words maximum entropy classifier |
| EOHSUVP | ohsu.hersh | 0.0693 | 0.7429 | 0.1267 | 0.5869 | abstract title, word, MeSH, and gene tokens Chi-square feature selection Voting perceptron classifier |
| EOHSUSL | ohsu.hersh | 0.0365 | 0.9905 | 0.0705 | 0.5824 | abstract title, word, MeSH, and gene tokens Chi-square feature selection Slipper2 classifier |
| eIBMIRLmet | ibm-india.ramakrishnan | 0.0627 | 0.7333 | 0.1155 | 0.5621 | classifying using svmlight the document set obtained as positive after the rules (vectors mesh terms + class specific terms using the dic file). |
| eIBMIRLrul | ibm-india.ramakrishnan | 0.0642 | 0.7238 | 0.1179 | 0.5589 | applying rules (mesh term and class specific term in medline record), formed using the training set, on the document set obtained after MH - Mice screening |
| eQUNB11 | queensu.shatkay | 0.1086 | 0.6381 | 0.1856 | 0.5563 | The probabilistic approach was used for creating probabilistic models of thematic clusters of all the irrelevant documents first, and the feature selection was done on each resulting thematic cluster. The selected features were then used for classification into "in"/"out" with respect to Expression category. |
| eQUT18 | queensu.shatkay | 0.0967 | 0.5238 | 0.1632 | 0.4473 | The probabilistic approach was used for creating probabilistic models of thematic clusters of all the irrelevant documents first, and the resulting thematic clusters were then used for classification into "in"/"out" with respect to Expression category |
| eMUSCUIUC1 | uiuc.zhai | 0.2269 | 0.4667 | 0.3053 | 0.4418 | This is triageE task with SVM classification with semantic features and augmented training cases. Records without MeSH term mice are removed |
| eMUSCUIUC3 | uiuc.zhai | 0.1572 | 0.4762 | 0.2364 | 0.4363 | This is triageE task with SVM classification with semantic features and augmented training cases. Record without MeSH mice are also included. |
| eQUNB19 | queensu.shatkay | 0.1132 | 0.4571 | 0.1815 | 0.4012 | The naive Bayes approach for classification into "in"/"out" with respect to Expression category. The different costs on different misclassifications were taken into account. |
| eUCHSCnb1En4 | ucolorado.cohen | 0.52 | 0.3714 | 0.4333 | 0.3661 | Categorized based on select bigrams, extracted strain names, and mesh terms. Classifications performed with NaiveBayes. Less strict feature selection. |
| FTE | erasmus.kors | 0.0835 | 0.4095 | 0.1387 | 0.3393 | Fulltext E |
| eUCHSCnb1En3 | ucolorado.cohen | 0.5714 | 0.3429 | 0.4286 | 0.3388 | Categorized based on select bigrams, extracted strain names, and mesh terms. Classifications performed with NaiveBayes. More strict feature selection. |
| eNLMF | nlm-umd.aronson | 0.129 | 0.2286 | 0.1649 | 0.2045 | Voting |
| eNLMKNN | nlm-umd.aronson | 0.0519 | 0.2381 | 0.0852 | 0.1701 | Mixture |
| eLRIk3 | uparis-sud.kodratoff | 0.0828 | 0.1238 | 0.0992 | 0.1024 | Automatic + Rap + list. |
| eLRIk1 | uparis-sud.kodratoff | 0.1026 | 0.1143 | 0.1081 | 0.0987 | automatic |
| eLRIk2 | uparis-sud.kodratoff | 0.1026 | 0.1143 | 0.1081 | 0.0987 | Automatic + list. |
| eUCHSCsvm | ucolorado.cohen | 1 | 0.0381 | 0.0734 | 0.0381 | Categorized based on select bigrams, extracted strain names, and mesh terms. Classifications performed with Support Vector Machine. |
| eMUSCUIUC2 | uiuc.zhai | 0 | 0 | 0 | -0.0074 | This is triageE task with SVM classification with semantic features. |
| Minimum | 0 | 0 | 0 | -0.0074 | ||
| Median | 0.122 | 0.8 | 0.1985 | 0.6413 | ||
| Maximum | 1 | 0.9905 | 0.4333 | 0.8711 |
| Tag | Group | Prec | Recall | Fscore | Utility | Description |
| gFduMarsII | fudan.niu | 0.2122 | 0.8861 | 0.3424 | 0.587 | Porter Stemmer, Pubmed Stopword, Certain Domain Retrieval Otherness Model, SVM, specified feature |
| gFduMarsI | fudan.niu | 0.2644 | 0.778 | 0.3947 | 0.5813 | Porter Stemmer, Pubmed Stopword, Certain Domain Retrieval Otherness Model, SVM |
| gIBMIRLmet | ibm-india.ramakrishnan | 0.2028 | 0.9015 | 0.3311 | 0.5793 | classifying using SVM the document set obtained as positive after the rules (vectors mesh terms + class specific terms using the dic file). |
| gDUTCat1 | dalianu.yang | 0.1914 | 0.9286 | 0.3174 | 0.572 | Documents are classified indepedently by three parts, its PMID record's MeSH term, full text, and title plus abstract. Then the results are combined by a evaluation program. We use a svm classifier, backspace-separated words as features, a tfidf method to set weights. Full texts are processed by A Biomedical Named Entity Recognizer(abner). Finally the positive instances are filtered with a algorithm according to the numbers of proteins of each document. |
| gIBMIRLrul | ibm-india.ramakrishnan | 0.1883 | 0.9286 | 0.3132 | 0.5648 | applying rules (mesh term and class specific term in medline record), formed using the training set, on the document set obtained after MH - Mice screening |
| gIBMIRLsvm | ibm-india.ramakrishnan | 0.2069 | 0.8668 | 0.3341 | 0.5648 | classifying using SVM of documents (vectors mesh terms + class specific terms using the dic file) obtained after MH - Mice screening |
| gFduMarsIII | fudan.niu | 0.191 | 0.9093 | 0.3157 | 0.5591 | Porter Stemmer, Pubmed Stopword, MeSH Tree Extracted Knowledge, Rocchio |
| GBBR004 | ibm.kanungo | 0.1947 | 0.8938 | 0.3198 | 0.5577 | Go annotation task, use bayesian regression with full text representation (tuned threshold) and MH_Mesh check. |
| GOHSUBF | ohsu.hersh | 0.1889 | 0.9093 | 0.3127 | 0.5542 | abstract title, word, MeSH, and gene tokens Chi-square feature selection Best-single feature classifier |
| GAbsBBR0083 | ibm.kanungo | 0.2524 | 0.7548 | 0.3783 | 0.5516 | Go annotation task, use bayesian regression with abstract text representation (derived threshold) and MH_Mesh check. |
| GOHSUVP | ohsu.hersh | 0.2308 | 0.7819 | 0.3564 | 0.5449 | abstract title, word, MeSH, and gene tokens Chi-square feature selection Voting perceptron classifier |
| GSVMN08 | ibm.kanungo | 0.2038 | 0.8436 | 0.3283 | 0.5441 | Go annotation task, use support vector machine with full text representation (tuned threshold) and MH_Mesh check. |
| gDUTCat2 | dalianu.yang | 0.1779 | 0.9363 | 0.2989 | 0.5428 | Documents are classified indepedently by three parts, its PMID record's MeSH term, full text, and title plus abstract. Then the results are combined by a evaluation program. We use a svm classifier, backspace-separated words as features, a tfidf method to set weights. Full texts are processed by A Biomedical Named Entity Recognizer(abner). |
| gNTUMAC | ntu.chen | 0.1873 | 0.8803 | 0.3089 | 0.5332 | Mesh10+Caption10+MeshSEM10 |
| gibmadz05m2 | ibm.zhang | 0.3179 | 0.6216 | 0.4206 | 0.5004 | Combined classifiers with cross-validation thresholding. |
| gibmadz05m1 | ibm.zhang | 0.3216 | 0.6178 | 0.423 | 0.4993 | Combined classifiers with probability thresholding. |
| ABPLUSG | erasmus.kors | 0.2178 | 0.7259 | 0.3351 | 0.4889 | Abstracts plus mesh headings plus chemicals G |
| gDIMACSl9w | rutgers.dayanik | 0.245 | 0.668 | 0.3585 | 0.4809 | Fulltext obtained from journal articles' subject, title, abstract and body fields were used for document representation. Text representation stemmed, logtf-idf, cosine normalization. A classifier, Bayesian Binary Regression (BBR) with Laplace prior, was trained, and used to make predictions with maximum expected effectiveness threshold tuning. |
| gibmadz05s | ibm.zhang | 0.3226 | 0.583 | 0.4154 | 0.4717 | Single classifiers. |
| GOHSUSL | ohsu.hersh | 0.2536 | 0.6429 | 0.3637 | 0.4709 | abstract title, word, MeSH, and gene tokens Chi-square feature selection Slipper2 classifier |
| gDIMACSl9md | rutgers.dayanik | 0.2425 | 0.6564 | 0.3542 | 0.47 | Article title, abstract and MEDLINE MeSH terms were used for document representation. Text representation stemmed, logtf-idf, cosine normalization. A classifier, Bayesian Binary Regression (BBR) with Laplace prior, was trained and used to make predictions with maximum expected effectiveness threshold tuning. |
| cuhkrun1G | cuhk.lam | 0.2706 | 0.6139 | 0.3757 | 0.4635 | Automatic classification using context feature engineering and context association. |
| gDIMACSg9md | rutgers.dayanik | 0.2529 | 0.6293 | 0.3608 | 0.4603 | Article title, abstract and MEDLINE MeSH terms were used for document representation. Text representation stemmed, logtf-idf, cosine normalization. A classifier, Bayesian Binary Regression (BBR) with Gaussian prior, was trained and used to make predictions with maximum expected effectiveness threshold tuning. |
| NLM2G | nlm-umd.aronson | 0.3223 | 0.5656 | 0.4107 | 0.4575 | ML methods |
| Gpars | uwisconsin.craven | 0.1862 | 0.7587 | 0.299 | 0.4572 | averaging the posterior probabilities of selected individual paragraphs as assigned by a maximum entropy classifier trained on full documents |
| gDIMACSg9w | rutgers.dayanik | 0.2754 | 0.5965 | 0.3768 | 0.4538 | Fulltext obtained from journal articles' subject, title, abstract and body fields were used for document representation. Text representation stemmed, logtf-idf, cosine normalization. A classifier, Bayesian Binary Regression (BBR) with Gaussian prior, was trained, and used to make predictions with maximum expected effectiveness threshold tuning. |
| THUIRgenGMNG | tsinghua.ma | 0.2107 | 0.6776 | 0.3214 | 0.4468 | n-gram features. MeSH lib added. |
| Gmeta | uwisconsin.craven | 0.1689 | 0.7934 | 0.2785 | 0.4386 | for each document, the posterior probabilites of individiual paragraphs -- as assigned by a primary maximum entropy classifier -- are tallied as a distribution, which is then classified by a secondary maxent classifier |
| NLM1G | nlm-umd.aronson | 0.316 | 0.5405 | 0.3989 | 0.4342 | Mixture |
| cuhkrun2G | cuhk.lam | 0.2109 | 0.6506 | 0.3185 | 0.4293 | Customized learning by exploiting the symmetric property of attributes and instances. |
| Gfull | uwisconsin.craven | 0.1904 | 0.6988 | 0.2993 | 0.4287 | bag-of-words maximum entropy classifier |
| THUIRgenG1p1 | tsinghua.ma | 0.1827 | 0.6506 | 0.2852 | 0.3859 | Baseline run. Only distanced bigram features. |
| gQUNB15 | queensu.shatkay | 0.2102 | 0.5676 | 0.3067 | 0.3736 | The probabilistic approach was used for creating probabilistic models of thematic clusters of all the irrelevant documents first, and the feature selection was done on each resulting thematic cluster. The selected features were then used for classification into "in"/"out" with respect to GO category. |
| gNLMF | nlm-umd.aronson | 0.1887 | 0.6062 | 0.2878 | 0.3693 | Voting |
| gQUT22 | queensu.shatkay | 0.1811 | 0.6158 | 0.2799 | 0.3628 | The probabilistic approach was used for creating probabilistic models of thematic clusters of all the irrelevant documents first, and the resulting thematic clusters were then used for classification into "in"/"out" with respect to GO category |
| gQUNB12 | queensu.shatkay | 0.1603 | 0.6602 | 0.258 | 0.3459 | The naive Bayes approach was used for classification into "in"/"out" with respect to GO category. The different costs on different misclassifications were taken into account. |
| cuhkrun3G | cuhk.lam | 0.1651 | 0.5637 | 0.2554 | 0.3045 | Customized learning by exploiting the symmetric property of attributes and instances with all features. |
| gUCHSCnb1En3 | ucolorado.cohen | 0.4234 | 0.3417 | 0.3782 | 0.2994 | Categorized based on select bigrams, extracted strain names, and mesh terms. Classifications performed with NaiveBayes. More strict feature selection. |
| gMUSCUIUC1 | uiuc.zhai | 0.393 | 0.2799 | 0.3269 | 0.2406 | This is triageG task with SVM classification with full vocabulary. |
| FTG | erasmus.kors | 0.2211 | 0.2876 | 0.25 | 0.1955 | Fulltext G |
| gUCHSCnb1En4 | ucolorado.cohen | 0.5542 | 0.1776 | 0.269 | 0.1646 | Categorized based on select bigrams, extracted strain names, and mesh terms. Classifications performed with NaiveBayes. Less strict feature selection. |
| gUCHSCsvm | ucolorado.cohen | 0.406 | 0.1834 | 0.2527 | 0.159 | Categorized based on select bigrams, extracted strain names, and mesh terms. Classifications performed with Support Vector Machine. |
| gMUSCUIUC3 | uiuc.zhai | 0.0891 | 0.3456 | 0.1416 | 0.0242 | This is triageG task with SVM classification with sematnic feature. Parameter 'j' is set to 20. |
| gLRIk3 | uparis-sud.kodratoff | 0.0998 | 0.1158 | 0.1072 | 0.0209 | Automatic + List + Rap . |
| gLRIk2 | uparis-sud.kodratoff | 0.1 | 0.1023 | 0.1011 | 0.0186 | Automatic + list. |
| gLRIk1 | uparis-sud.kodratoff | 0.0938 | 0.1023 | 0.0979 | 0.0125 | Automatic |
| gMUSCUIUC2 | uiuc.zhai | 0.0706 | 0.1737 | 0.1004 | -0.0342 | This is triageG task with SVM classification with sematnic feature. Parameter 'j' is set to 8. |
| Minimum | 0.0706 | 0.1023 | 0.0979 | -0.0342 | ||
| Median | 0.2102 | 0.6506 | 0.3185 | 0.4575 | ||
| Maximum | 0.5542 | 0.9363 | 0.423 | 0.587 |
| Tag | Group | Prec | Recall | Fscore | Utility | Description |
| tDIMACSg9w | rutgers.dayanik | 0.0709 | 1 | 0.1325 | 0.9433 | Fulltext obtained from journal articles' subject, title, abstract and body fields were used for document representation. Text representation stemmed, logtf-idf, cosine normalization. A classifier, Bayesian Binary Regression (BBR) with Gaussian prior, was trained, and used to make predictions with maximum expected effectiveness threshold tuning. |
| TSVM0035 | ibm.kanungo | 0.0685 | 1 | 0.1282 | 0.9411 | Tumor task, use support vector machine with full text representation (tuned threshold) and MH_Mesh check. |
| tDIMACSg9md | rutgers.dayanik | 0.0556 | 1 | 0.1053 | 0.9264 | Article title, abstract and MEDLINE MeSH terms were used for document representation. Text representation stemmed, logtf-idf, cosine normalization. A classifier, Bayesian Binary Regression (BBR) with Gaussian prior, was trained and used to make predictions with maximum expected effectiveness threshold tuning. |
| tFduMarsI | fudan.niu | 0.1061 | 0.95 | 0.191 | 0.9154 | Porter Stemmer, Pubmed Stopword, Certain Domain Retrieval Otherness Model, SVM |
| tFduMarsII | fudan.niu | 0.099 | 0.95 | 0.1792 | 0.9126 | Porter Stemmer, Pubmed Stopword, Certain Domain Retrieval Otherness Model, SVM, specified feature |
| tIBMIRLmet | ibm-india.ramakrishnan | 0.0945 | 0.95 | 0.1719 | 0.9106 | classifying using svmlight the document set obtained as positive after the rules (vectors mesh terms + class specific terms using the dic file). |
| tDIMACSl9w | rutgers.dayanik | 0.0444 | 1 | 0.0851 | 0.9069 | Fulltext obtained from journal articles' subject, title, abstract and body fields were used for document representation. Text representation stemmed, logtf-idf, cosine normalization. A classifier, Bayesian Binary Regression (BBR) with Laplace prior, was trained, and used to make predictions with maximum expected effectiveness threshold tuning. |
| TBBR0004SThr | ibm.kanungo | 0.0436 | 1 | 0.0835 | 0.905 | Tumor task, First use bayesian regression with full text representation (derived threshold) and MH_Mesh check. Second, use output from SVM for sanity check. |
| cuhkrun3T | cuhk.lam | 0.0426 | 1 | 0.0818 | 0.9028 | Customized learning by exploiting the symmetric property of attributes and instances with all features. |
| tibmadz05m2 | ibm.zhang | 0.0757 | 0.95 | 0.1402 | 0.8998 | Combined classifiers with cross-validation thresholding. |
| tDUTCat1 | dalianu.yang | 0.0745 | 0.95 | 0.1382 | 0.8989 | Titles, absracts, bodies are used to represent the documents, backspace-separated words as features, a svm classifier , set weights using tfidf, all texts are processed with A Biomedical Named Entity Recognizer(abner). |
| tibmadz05s | ibm.zhang | 0.0688 | 0.95 | 0.1284 | 0.8944 | Single classifiers. |
| tibmadz05m1 | ibm.zhang | 0.0674 | 0.95 | 0.1258 | 0.8931 | Combined classifiers with probability thresholding. |
| TBBR0004 | ibm.kanungo | 0.0376 | 1 | 0.0725 | 0.8892 | Tumor task, use bayesian regression with full text representation (derived threshold) and MH_Mesh check. |
| tDUTCat2 | dalianu.yang | 0.035 | 1 | 0.0677 | 0.8807 | Titles, absracts are used to represent the documents, backspace-separated words as features, a svm classifier , set weights using tfidf. |
| tNTUMACwj | ntu.chen | 0.0518 | 0.95 | 0.0982 | 0.8747 | Mesh30+Caption30+wjAbstract30+AbstractSEM10+CaptionSEM30 |
| tIBMIRLrul | ibm-india.ramakrishnan | 0.0415 | 0.95 | 0.0795 | 0.855 | applying rules (mesh term and class specific term in medline record), formed using the training set, on the document set obtained after MH - Mice screening |
| cuhkrun1T | cuhk.lam | 0.0769 | 0.9 | 0.1417 | 0.8532 | Automatic classification using context feature engineering and context association. |
| tFduMarsIII | fudan.niu | 0.0286 | 1 | 0.0556 | 0.8528 | Porter Stemmer, Pubmed Stopword, MeSH Tree Extracted Knowledge, Rocchio |
| tNTUMAC | ntu.chen | 0.0526 | 0.9 | 0.0994 | 0.8299 | Mesh30+Caption30+Abstract30+AbstractSEM10+CaptionSEM30 |
| tDIMACSl9md | rutgers.dayanik | 0.0323 | 0.95 | 0.0625 | 0.8268 | Article title, abstract and MEDLINE MeSH terms were used for document representation. Text representation stemmed, logtf-idf, cosine normalization. A classifier, Bayesian Binary Regression (BBR) with Laplace prior, was trained and used to make predictions with maximum expected effectiveness threshold tuning. |
| Tpars | uwisconsin.craven | 0.0317 | 0.95 | 0.0613 | 0.8242 | averaging the posterior probabilities of selected individual paragraphs as assigned by a maximum entropy classifier trained on full documents |
| ABPLUST | erasmus.kors | 0.0314 | 0.95 | 0.0607 | 0.8229 | Abstracts plus mesh headings plus chemicals T |
| Tfull | uwisconsin.craven | 0.0443 | 0.9 | 0.0845 | 0.816 | bag-of-words maximum entropy classifier |
| Tmeta | uwisconsin.craven | 0.0523 | 0.85 | 0.0986 | 0.7833 | for each document, the posterior probabilites of individiual paragraphs -- as assigned by a primary maximum entropy classifier -- are tallied as a distribution, which is then classified by a secondary maxent classifier |
| THUIRgenT1p5 | tsinghua.ma | 0.0213 | 0.95 | 0.0417 | 0.761 | Baseline run. Only distanced bigram features. |
| TOHSUSL | ohsu.hersh | 0.0254 | 0.9 | 0.0493 | 0.7502 | abstract title, word, MeSH, and gene tokens Chi-square feature selection Slipper2 classifier |
| tQUNB3 | queensu.shatkay | 0.0244 | 0.9 | 0.0474 | 0.7439 | The naive Bayes approach was used for for classification into "in"/"out" with respect to Tumor category. The different costs on different misclassifications were taken into account. |
| TOHSUBF | ohsu.hersh | 0.0192 | 0.95 | 0.0376 | 0.7396 | abstract title, word, MeSH, and gene tokens Chi-square feature selection Best-single feature classifier |
| TOHSUVP | ohsu.hersh | 0.0237 | 0.9 | 0.0462 | 0.7394 | abstract title, word, MeSH, and gene tokens Chi-square feature selection Voting perceptron classifier |
| tMUSCUIUC3 | uiuc.zhai | 0.3182 | 0.7 | 0.4375 | 0.6935 | This is triageG task with SVM classification with sematnic feature and augmented training cases. Parameter 'j' is set to 20. Records without MeSH terms under the subtree 'neoplasma'. |
| tIBMIRLsvm | ibm-india.ramakrishnan | 0.0308 | 0.8 | 0.0593 | 0.6909 | classifying using SVM documents (vectors mesh terms + class specific terms using the dic file) obtained after MH - Mice screening |
| tQUT10 | queensu.shatkay | 0.0132 | 1 | 0.026 | 0.6758 | The probabilistic approach was used for creating probabilistic models of thematic clusters of all the irrelevant documents first, and the resulting thematic clusters were then used for classification into "in"/"out" with respect to the Tumor category. |
| tMUSCUIUC2 | uiuc.zhai | 0.0828 | 0.7 | 0.1481 | 0.6665 | This is triageG task with SVM classification with sematnic feature and augmented training cases. Parameter 'j' is set to 20. |
| tQUT14 | queensu.shatkay | 0.3095 | 0.65 | 0.4194 | 0.6437 | The probabilistic approach was used for creating probabilistic models of thematic clusters of all the irrelevant documents first, and the resulting thematic clusters were then used for classification into "in"/"out" with respect to the Tumor category. |
| NLM1T | nlm-umd.aronson | 0.0813 | 0.65 | 0.1444 | 0.6182 | Mixture |
| NLM2T | nlm-umd.aronson | 0.0813 | 0.65 | 0.1444 | 0.6182 | ML methods |
| tMUSCUIUC1 | uiuc.zhai | 0.3429 | 0.6 | 0.4364 | 0.595 | This is triageG task with SVM classification with sematnic feature. Parameter 'j' is set to 20. |
| tNTUMACasem | ntu.chen | 0.0339 | 0.65 | 0.0645 | 0.5699 | AbstractSEM10 |
| LPC7 | langpower.yang | 0.3548 | 0.55 | 0.4314 | 0.5457 | System built using rule-based NLP parsing and concept-based indexing. |
| FTT | erasmus.kors | 0.0893 | 0.5 | 0.1515 | 0.4779 | Fulltext T |
| tNLMF | nlm-umd.aronson | 0.0207 | 0.55 | 0.0399 | 0.4372 | Voting |
| cuhkrun2T | cuhk.lam | 0.0268 | 0.4 | 0.0503 | 0.3372 | Customized learning by exploiting the symmetric property of attributes and instances. |
| tUCHSCnb1En3 | ucolorado.cohen | 0.1935 | 0.3 | 0.2353 | 0.2946 | Categorized based on select bigrams, extracted strain names, and mesh terms. Classifications performed with NaiveBayes. More strict feature selection. |
| tUCHSCnb1En4 | ucolorado.cohen | 0.375 | 0.15 | 0.2143 | 0.1489 | Categorized based on select bigrams, extracted strain names, and mesh terms. Classifications performed with NaiveBayes. Less strict feature selection. |
| tLRIk2 | uparis-sud.kodratoff | 0.0909 | 0.1 | 0.0952 | 0.0957 | Automatic + list. |
| tLRIk1 | uparis-sud.kodratoff | 0.087 | 0.1 | 0.093 | 0.0955 | Automatic |
| tLRIk3 | uparis-sud.kodratoff | 0.069 | 0.1 | 0.0816 | 0.0942 | Automatic + list + rap. |
| tUCHSCsvm | ucolorado.cohen | 1 | 0.05 | 0.0952 | 0.05 | Categorized based on select bigrams, extracted strain names, and mesh terms. Classifications performed with Support Vector Machine. |
| Tcsusm2 | csusm.guillen | 0.0256 | 0.05 | 0.0339 | 0.0418 | A third pass was added at the end for this run. In this pass we filtered the documents left from the second pass using the keywords not to choose documents. The decision making process was also done with decision rules. |
| Tcsusm1 | csusm.guillen | 0.0244 | 0.05 | 0.0328 | 0.0413 | The documents went through two passes. In the first pass we selected those documents containing the keywords as they appear in Area tumor column "Always select" (Library Triage Cheat Sheet). In a second pass we discarded those documents including Cell Lines for mouse and human (Library Triage Cheat Sheet). The decision making process in both passes is done with decision rules |
| Minimum | 0.0132 | 0.05 | 0.026 | 0.0413 | ||
| Median | 0.0526 | 0.9 | 0.0952 | 0.761 | ||
| Max | 1 | 1 | 0.4375 | 0.9433 |